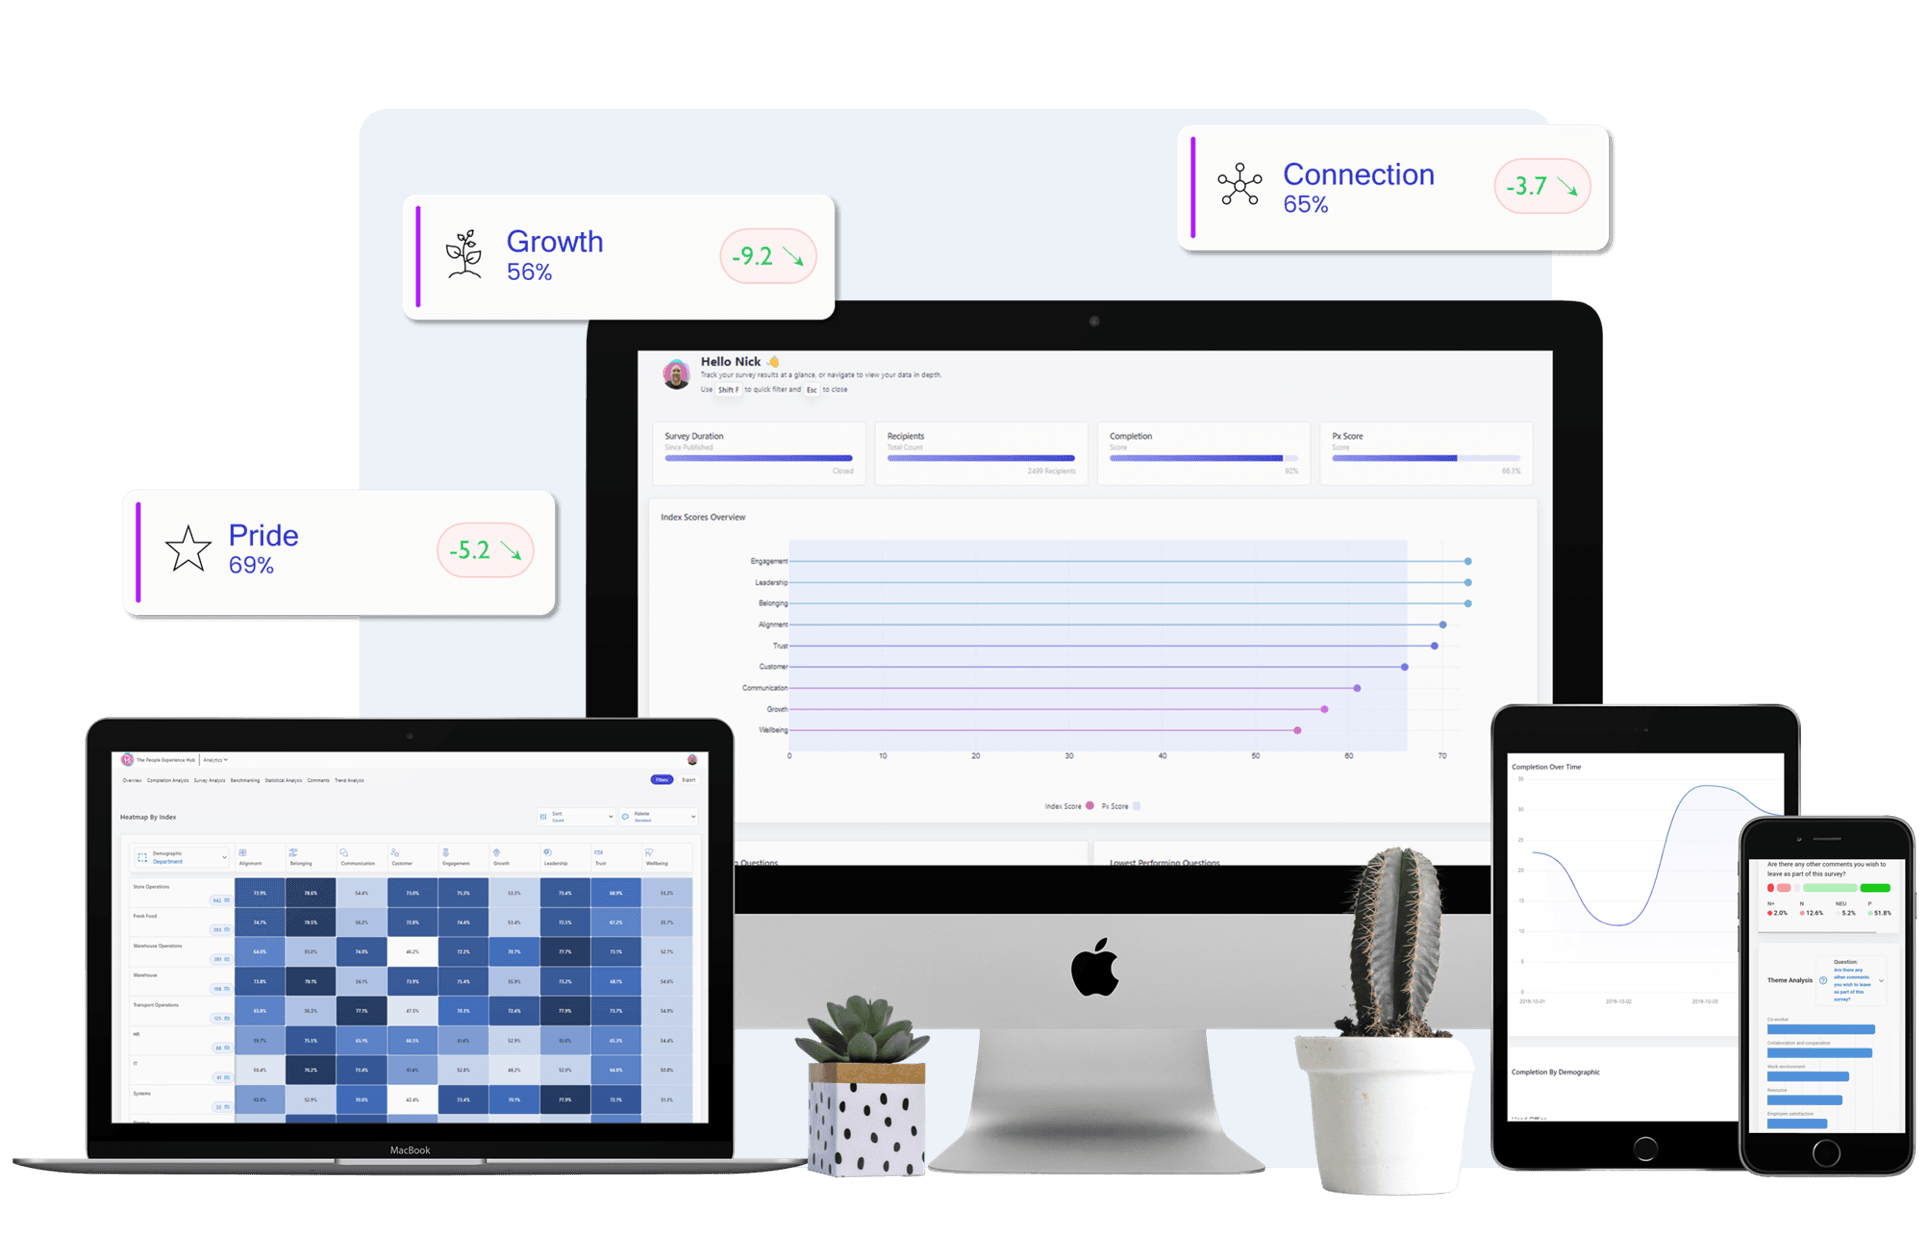
Real-Time Dashboards: Insights at Your Fingertips
Unlock the true potential of surveys with dashboards, analytics, and insights. Turn data into meaningful actions, understand sentiments and themes or compare results with internal and external benchmarks. Make informed decisions and enhance the employee experience.
Proud to have delivered Insights and Data to some amazing organisations
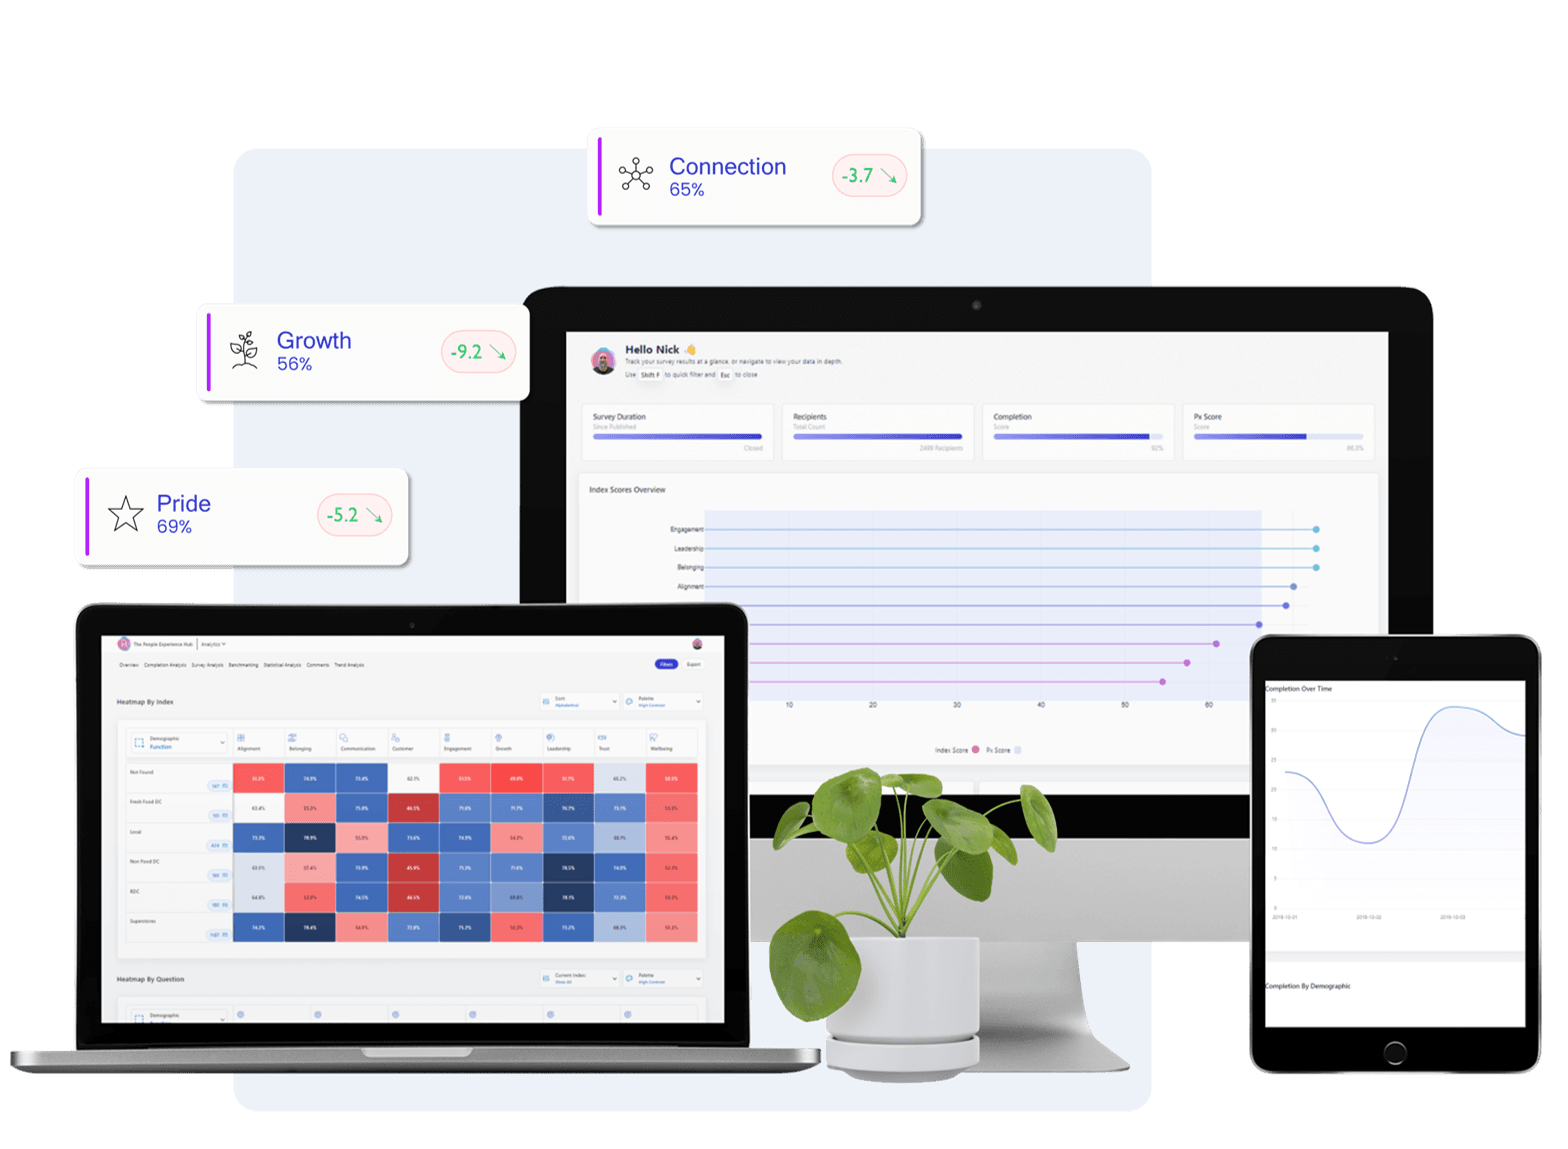
Accessible, Insightful, and User-friendly Dashboards
✔️ Online Dashboards: Visualise real-time survey data with completion analysis, heatmaps, and index performance at a glance
✔️ Manager Dashboards: Provide managers access to team-specific dashboards
✔️ AI-Powered Free-Text Analytics: Analyse sentiment and theme, generating valuable context from open-ended questions to understand people's experiences
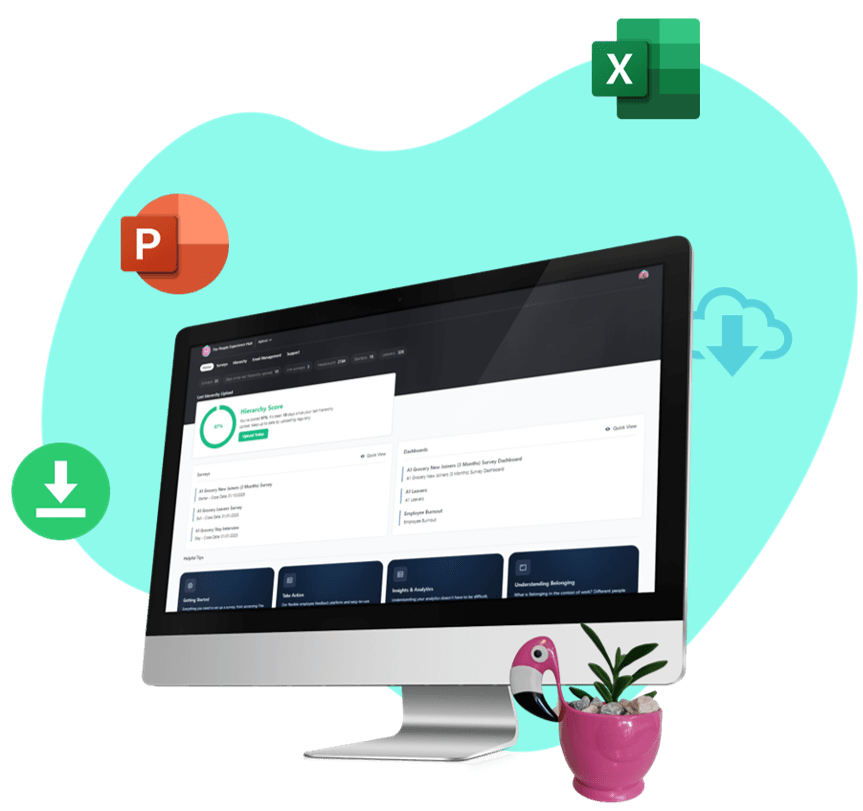
✔️ Downloadable Dashboards: Make insights accessible by downloading dashboards to Excel or PowerPoint for easy sharing and further analysis
✔️ Trend Analysis & Benchmarking: Explore trends, compare against internal and External benchmarks to give you in-depth understanding and informed decision-making
The biggest problem with any Employee Feedback dashboards is that they are designed by data analysts for analysts!
Dashboards
At The People Experience Hub we know that what you need are Dashboards that have been designed with the end user in mind AND the end goal, which is to make work a better place.
Designed
This is why our Dashboards have been designed by People Analytics experts who have sat in your seat. Simply to use, easy to understand and flexible to your organisation's needs.
For You
AI-Powered Free-Text Analysis
Free text questions can be a nightmare to read through, extract the common themes and to tell if people are frustrated or pretty satisfied!
Word Clouds and Word Counts just don't give you rich data with any context! (and let's be honest, a word cloud is a bit 1980's right!)
There is a better way - Say Hello to Px Hub Ai!
🔮 Stop Guessing and start diving deep into the sentiment in your surveys (Negative, Neutral, Positive) and pulling out the themes in the text.
Combined with Key Word Triggers and Comment Search functionality, free text is now no longer a chore!

Export your Dashboards at the Click of a Button
For wider audience accessibility or further exploration, you can easily download dashboard views (complete with any applied filters) whenever you need to.
⬇️ Download to PowerPoint for editable presentations
⬇️ Download to Excel for a hands-on look at raw data tables
⬇️ Download free text comments to Excel to deep dive into your people's feedback
Learn More about People Analytics
We are experts in visualising the Employee Experience and we love to share what we know!
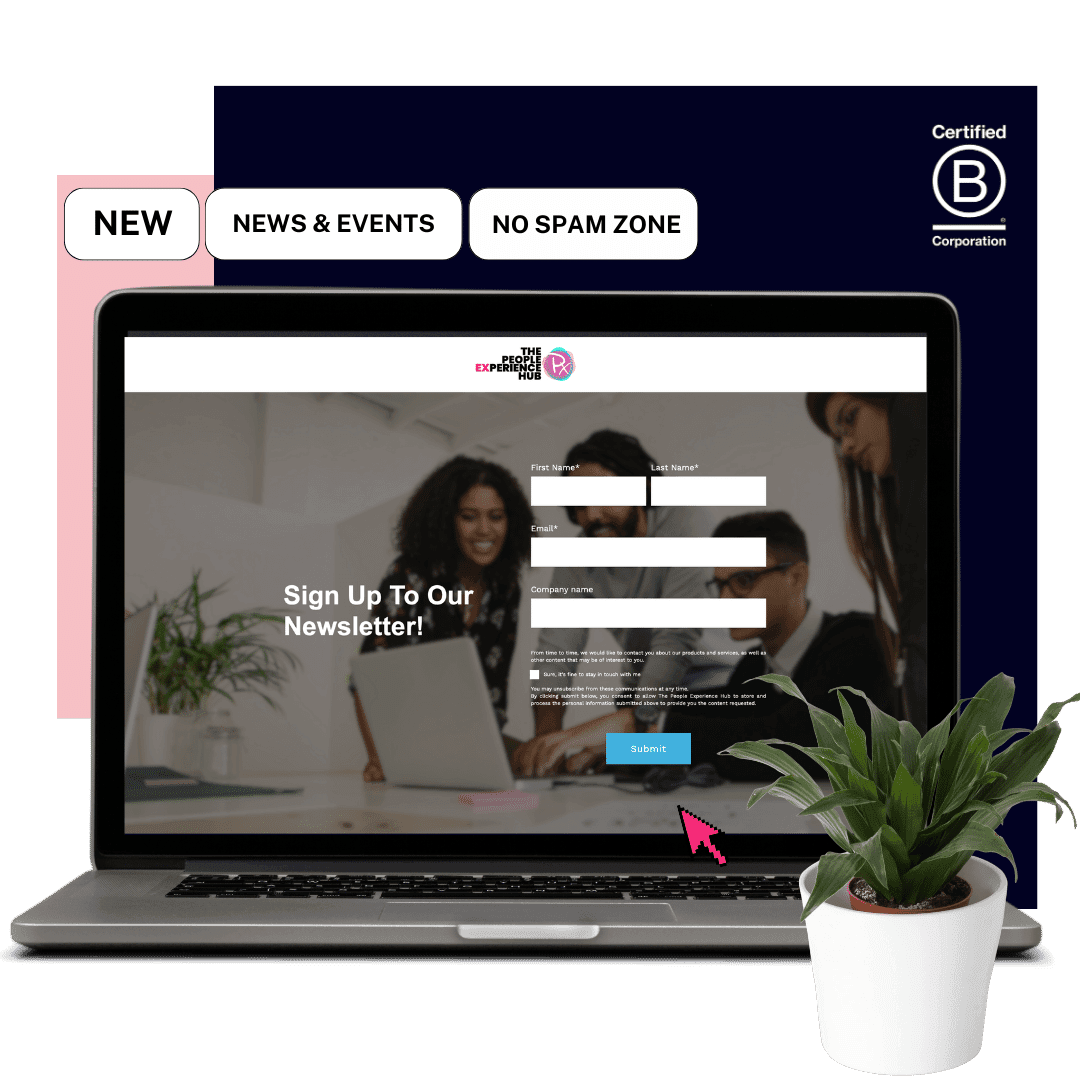
PxHub news at your fingertips
Our newsletter is a no-spam zone, you will only receive a newsletter once a month containing company updates, events and occasional photos of dogs